Statistics from the internet. What should we believe?
This is a loosely translated English version of a Japanese article from the CJ Column.
https://citrusjapan.co.jp/column/cj-column/w010_201804.html

The Internet is convenient. You can find the right answers to just about any question with a quick search. Right?
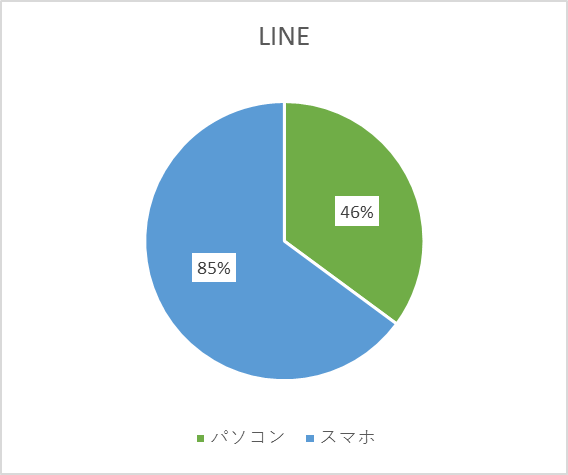
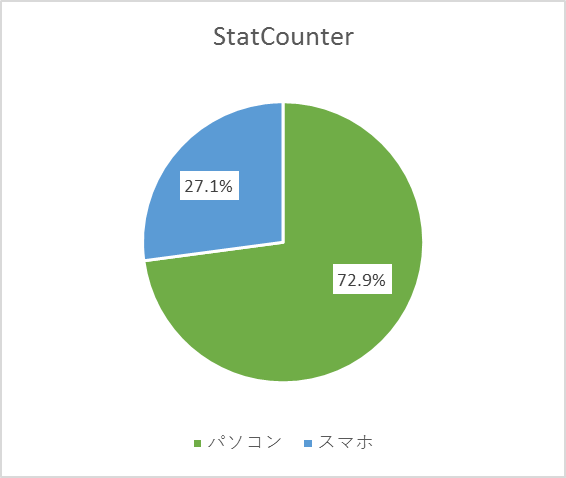
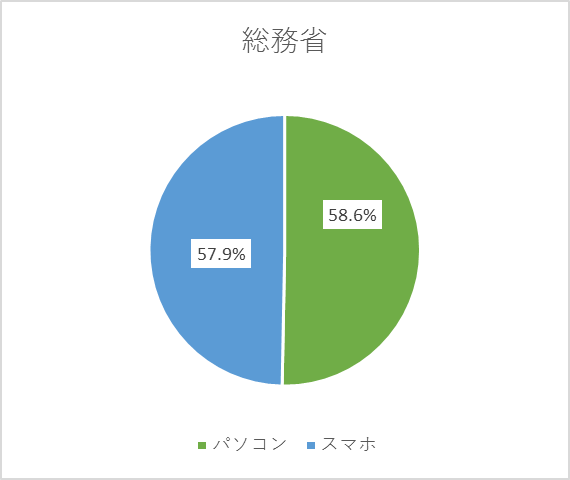
As a test, let’s compare statistics on the percentage of Japanese internet users on PCs and smartphones. Here are three sources:
- StatCounter
- LINE survey
- Ministry of Internal Affairs and Communications (MIC) 2017 white paper


The results appear to conflict. So which source should we believe? The government source? As a matter of fact, all three pie charts are correct, but their statistical methods differ. The following table compares the statistical methods used.
|
Item |
StatCounter |
LINE |
MIC |
|
Period |
2017….. |
April 2017 |
Dec – Jan 2016 |
|
Area |
All Japan |
All Japan |
All Japan |
|
Age |
Unknown |
15-50 year olds |
6 to 80 year olds |
|
Gender |
Male and female |
Male and female |
Male and female |
|
Sample |
149,380,381 |
759 |
44,430 |
|
Survey method |
Access analysis software installed in 2 million websites |
Questionnaire delivered by researcher and filled out at the subject's home |
Questionnaire distributed by postal or online mail |
As the table makes clear, the data differs depending on the survey method, target area, research institution, number and age of subjects, date of information, etc.
Only similar data should be compared, and we must always be careful to evaluate and understand the data ourselves before making use of it.


